
How I Let Claude Code Build My Startup Dashboard
I needed a dashboard for my new project. Signups, revenue, the usual metrics. Instead of building it myself, I tried something new: I pointed Claude Code at the Indiequery API docs and told it what I wanted to track. Ten minutes later I had a working dashboard with charts.
It worked so well I wanted to share the setup in case it's useful for others.
The Problem with Custom Dashboards
You could ask your AI agent to build a custom dashboard from scratch. It'll npm install a charting library, set up React components, figure out the styling, wire up database connections. A few hours later you're debugging why the Y-axis labels are cut off on mobile.
I've been down this road a few times. It works eventually, but I wanted something simpler. Something I could check on my phone without spinning up a dev environment or running another AI session every time I want to see my numbers.
So I tried letting Claude Code build a dashboard through the Indiequery API instead. The queries and charts live in Indiequery, ready whenever I need them.
What I Built
I'm Marc Hendricks. I'm building immopix.ai, an AI image generation tool. When I launched, I wanted to track:
- Daily signups
- Total images created
- AI image generation latency (p50, p95)
- Revenue
I gave Claude Code the Indiequery API documentation and described what I wanted. It read the docs, figured out authentication, pulled my database schema, wrote the queries, and created the dashboard.
The whole thing took maybe 10 minutes. Most of that was me reading what Claude was doing and clicking approve on the API calls.
How It Works
The AI agent handles all the API work. Here's the basic flow:
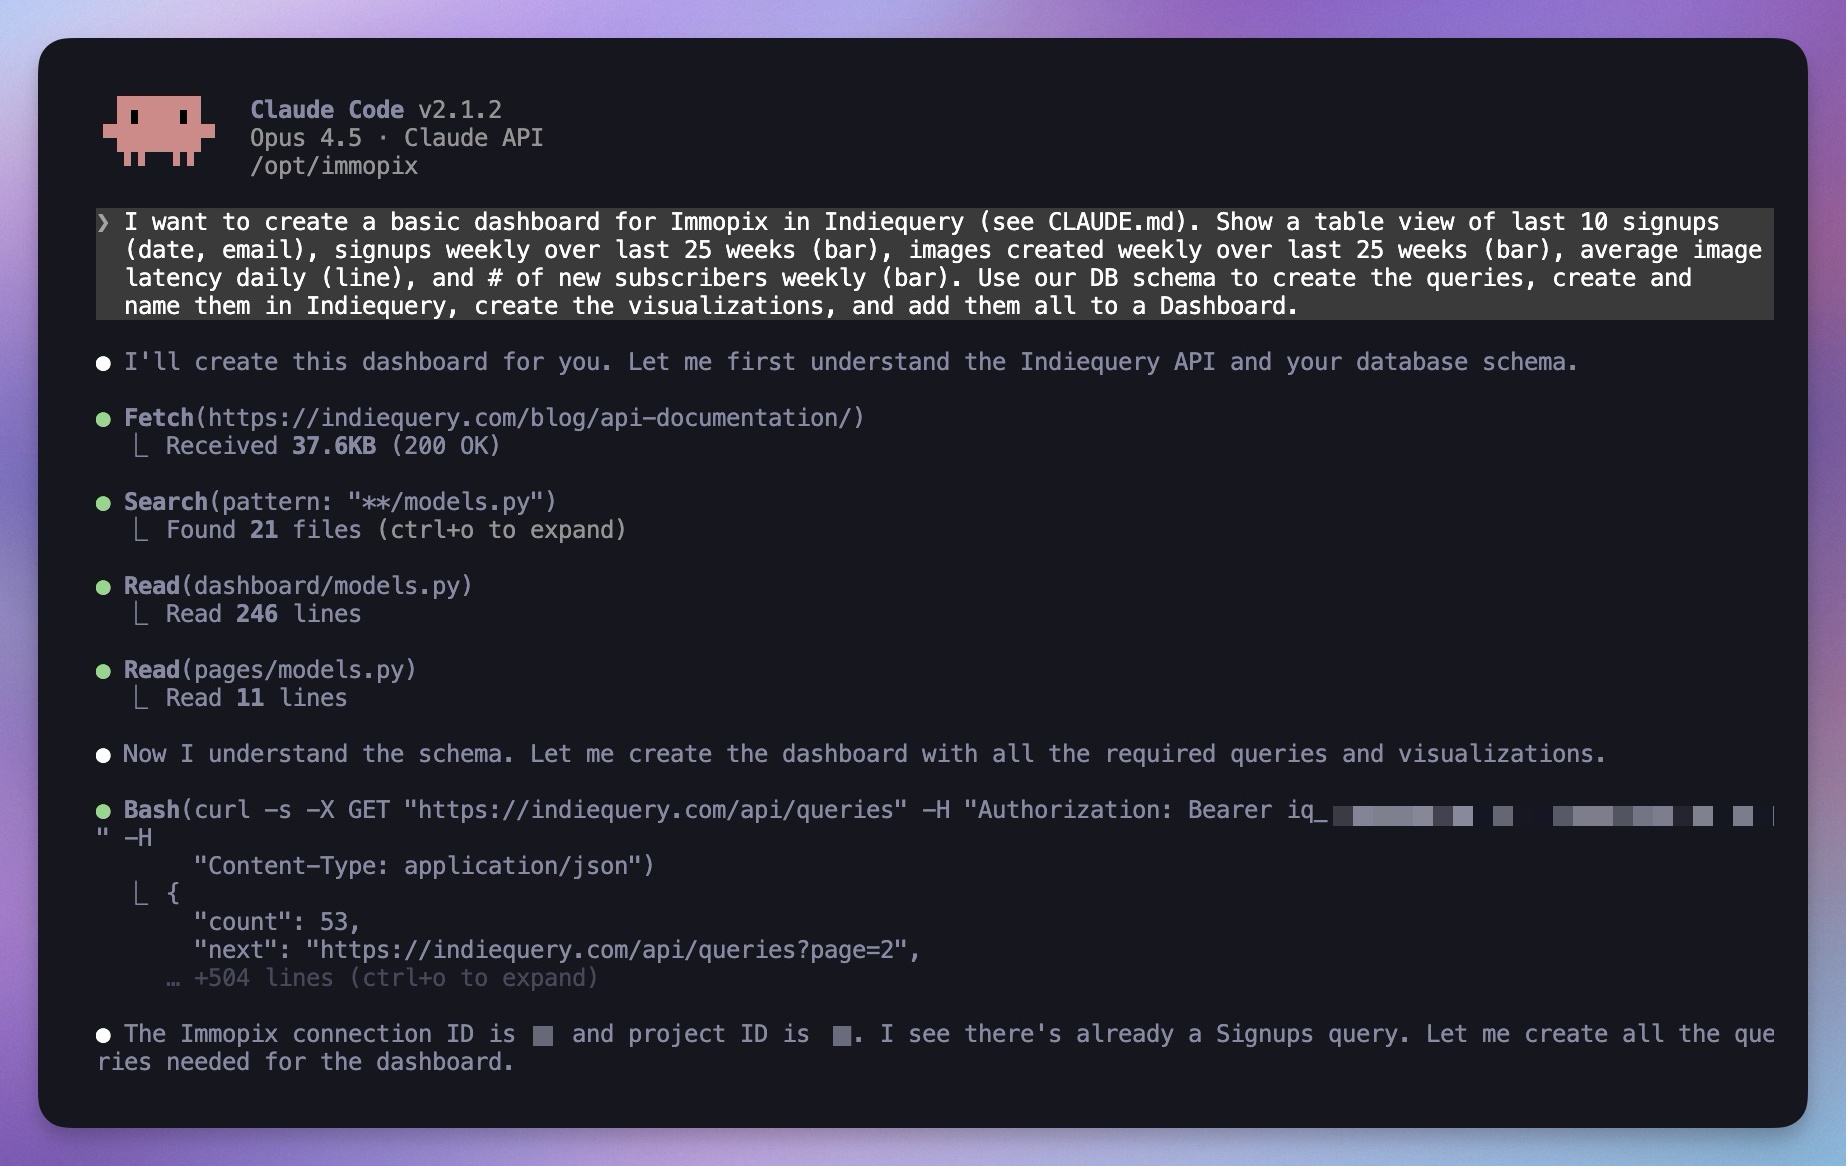
I gave Claude Code my Indiequery API key and pointed it at the API docs. Then I just described what I wanted. Like: "I want to create a basic dashboard for Immopix in Indiequery (see CLAUDE.md). Show a table view of last 10 signups (date, email), signups weekly over last 25 weeks (bar), images created weekly over last 25 weeks (bar), average image latency daily (line), and # of new subscribers weekly (bar). Use our DB schema to create the queries, create and name them in Indiequery, create the visualizations, and add them all to a Dashboard."
Claude already knows my database schema from the codebase, so it wrote the SQL queries, called the Indiequery API to save and run them, and assembled everything into a dashboard. I just watched and approved the API calls as necessary.
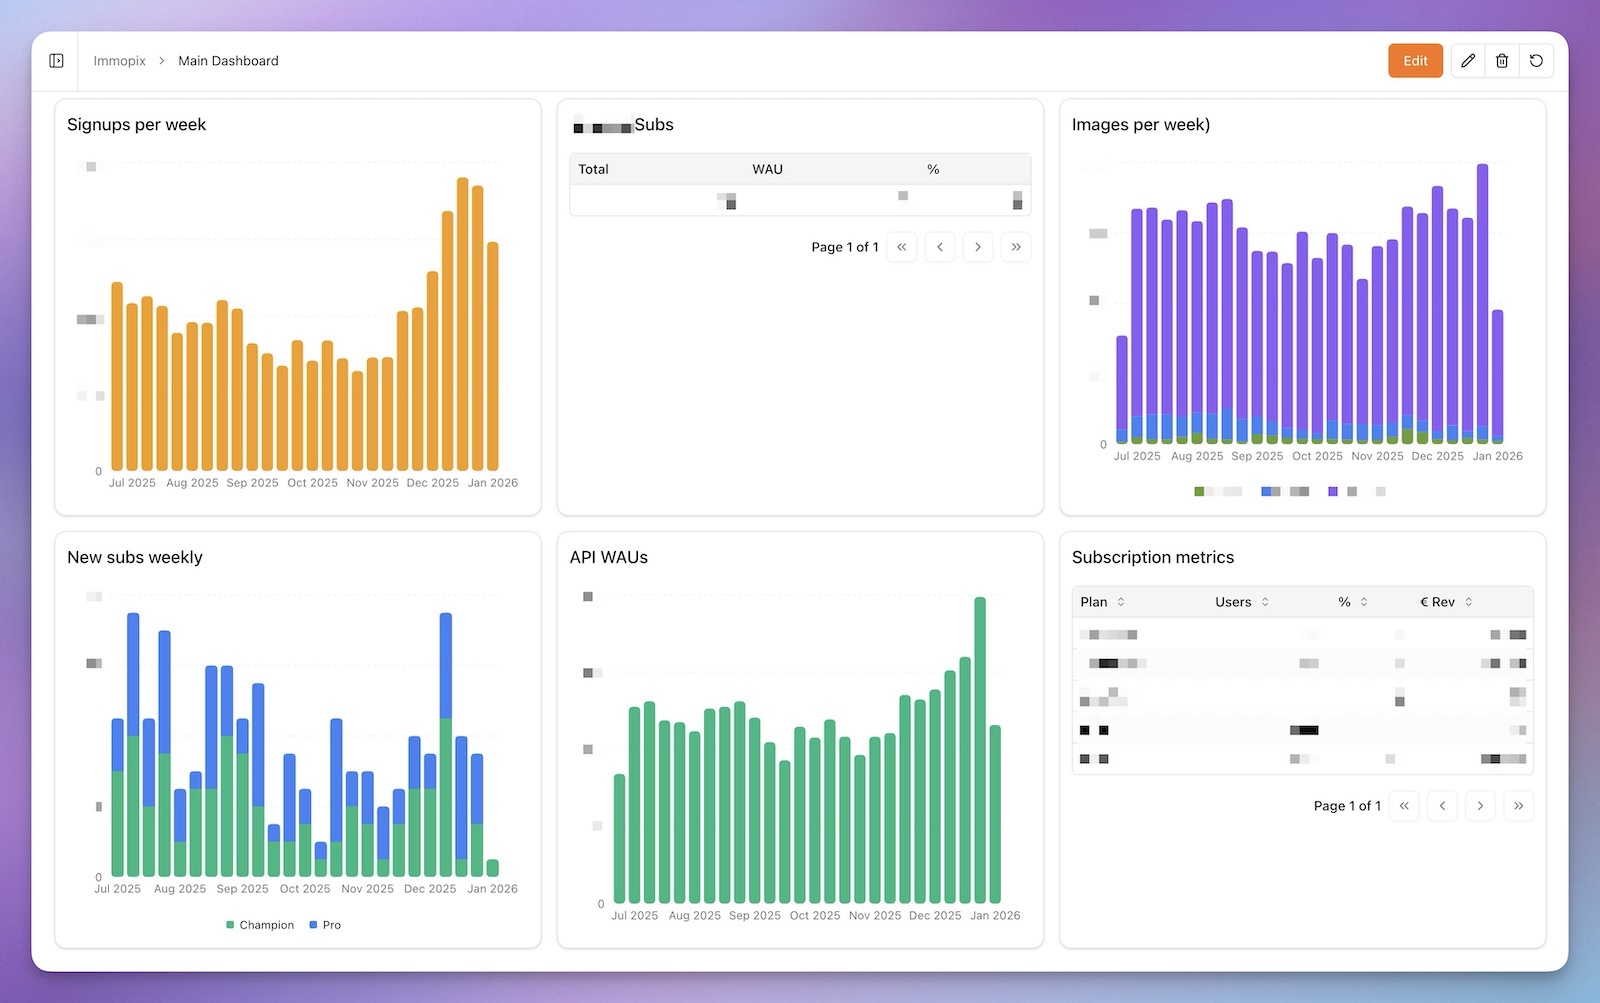
The final product:
Works With Other Tools and Databases
I used Claude Code because that's my usual setup, but this should work just as well with Cursor, Gemini CLI, Codex, or any AI coding tool that can read docs and make HTTP requests.
Indiequery supports both PostgreSQL and MySQL with the same API. Handy if you're running different databases across projects.
Getting Started
If you want to try this yourself:
- Connect your database to Indiequery
- Generate an API key from your account settings
- Give your AI agent the API documentation
- Tell it what you want to track
If you're running Claude Code on a VPS, the vibeservering guide covers that setup.
There's also an AI query editor built into Indiequery if you'd rather build queries through the web UI.
Is This Worth It vs Building Your Own?
Honestly, it depends on what you enjoy. If you like building custom dashboards and have the time, go for it. There's something satisfying about having full control.
For me, I'd rather spend that time on the product itself. $9/month for charts that just work felt like a good trade. But your situation might be different.
Hope this is helpful! If you try it out, I'd love to hear how it goes.